
The support and resistance are not merely boring lines on the chart. They are the unseen walls which prevent prices from going wild. Traders consider them as secret handshakes; once you know them, you are inside the club.
We at Primefx think that support and resistance reveal more than the technical patterns. We show the struggle between supply and demand. This struggle reveals trader psychology and the actions of influential institutional players.
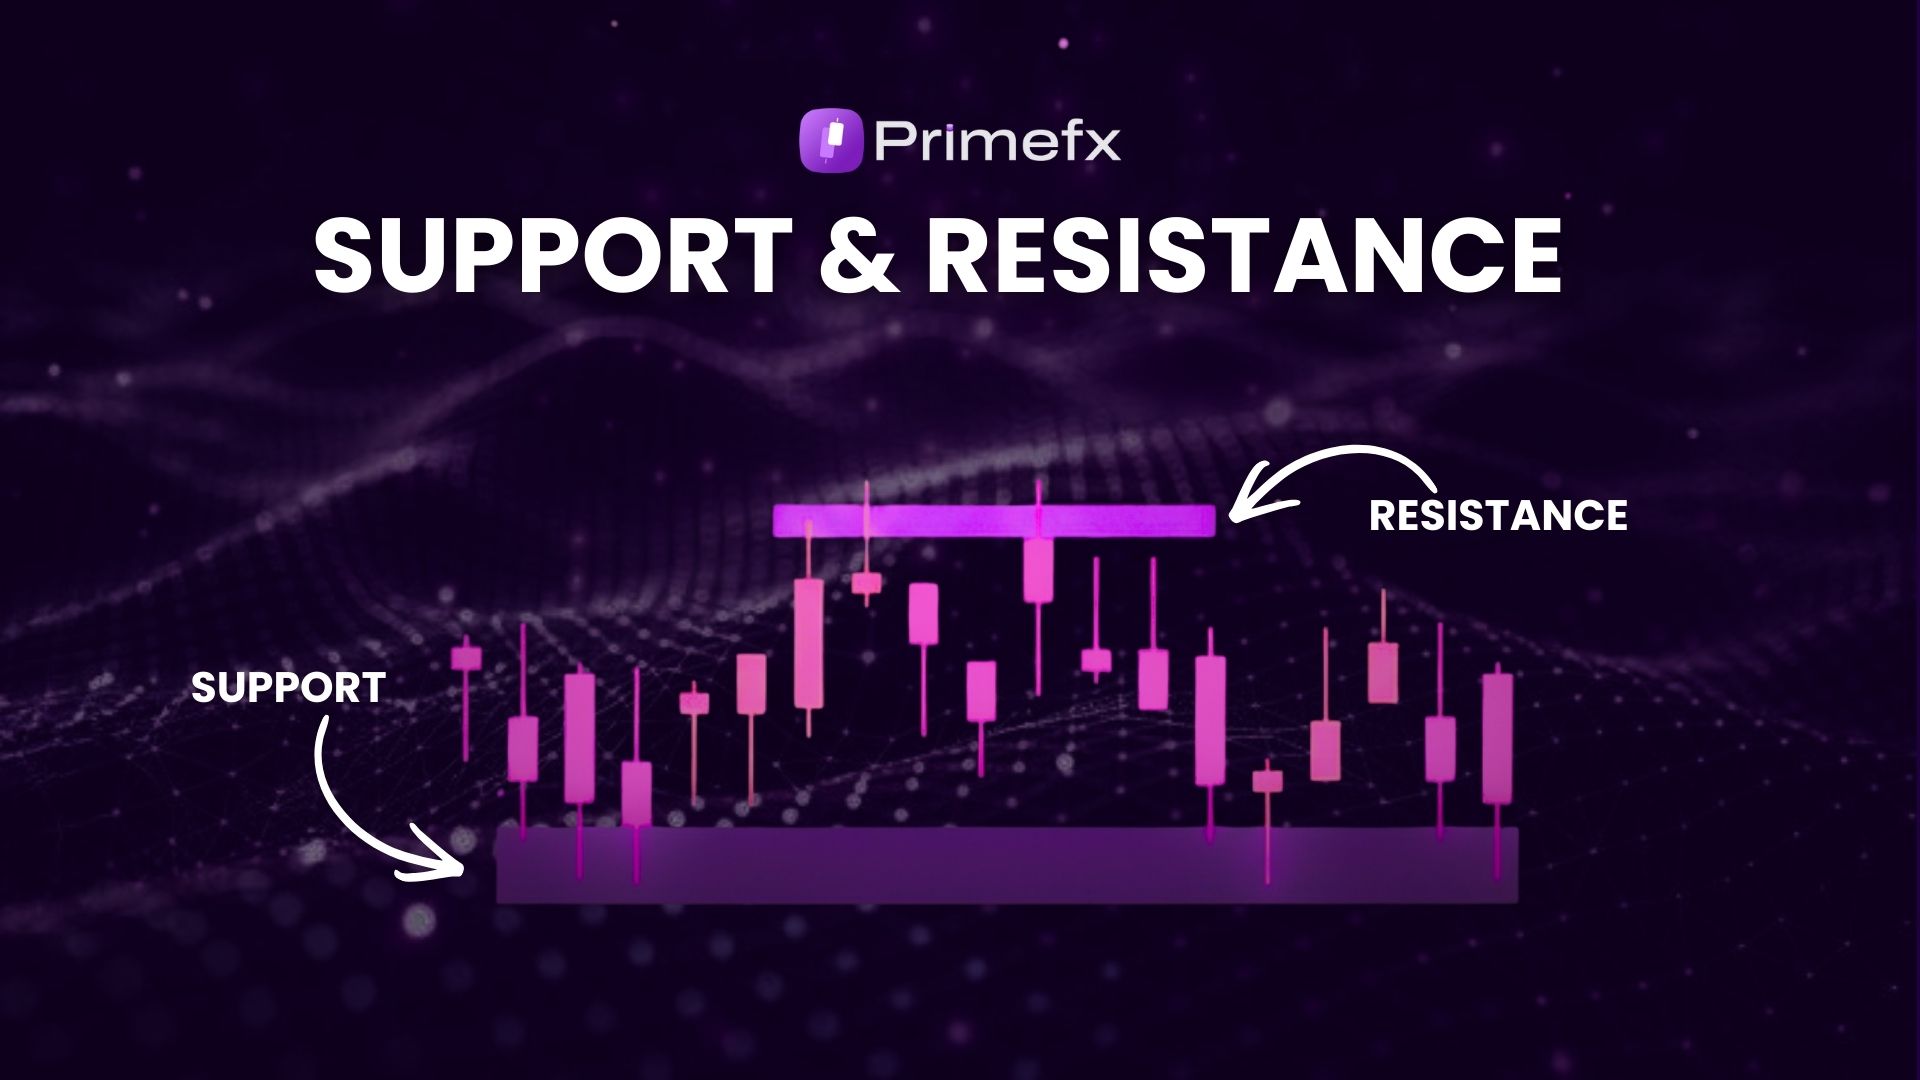
Support and resistance form the backbone of most trading strategies. They show where buyers and sellers clash, revealing points where the market may pause, reverse, or start a new trend.
Support is a price level at which demand is strong enough to prevent prices from falling further.
It functions like a floor for the market: buyers enter when prices approach this level because they believe the asset is more valuable.
Sellers, on the other hand, are hesitant to sell because they don't want to sell too cheaply. This group behaviour stabilises the market and typically raises prices.
Resistance, by contrast, is a price level at which supply is sufficiently strong to prevent prices from rising. It functions as a ceiling on the market.
When prices approach resistance, sellers rush to lock in profits or open short positions. While buyers hold off because they don't want to pay too much. This puts pressure on sellers, which stops momentum and often causes prices to fall.
Demand = Support → Buyers Step In, Prices Stay the Same
Whenever the price falls to a support level, such as $50, buyers often step in because they see it as cheap. If a stock continues to rise after hitting $50, sellers start selling to take profits. This makes it difficult for the price to increase. Such levels are resistance.
Resistance equals Supply → Sellers Rule, Prices Stop
Resistance levels are areas where traders expect that supply will exceed demand. Resistance is the level that a currency pair can't get over.
Here, sellers are in charge, creating a ceiling that prevents future advances. Traders often employ resistance levels to lock in profits.
Price Breaks → Changes in Sentiment
When the price moves above or below support or resistance, it indicates that the market's sentiment has changed. If the price falls below support, it indicates that sellers have outpaced buyers, which will cause prices to drop further.
A break over resistance indicates that buyers have prevailed over sellers, leading to a rise. Such breaks can trigger strong price moves, especially if trading volume supports them.
Future Price → Predicting the Direction of the Market
Traders utilise support and resistance to guess how prices will move in the future. Prices may go up if support holds. Prices may go down if resistance holds.
Traders think that if either level breaks, a new trend will start. Because they help forecast price moves, support and resistance are vital for planning trades and stop-loss levels.
Primefx Insight
At Primefx, we stress that support and resistance are not merely lines that stay the same; they are areas where you may make money. They show how people think and how institutions act.
Traders can develop strategies that adapt to market conditions by using these levels, along with trend lines and moving averages.
For clients, this means making decisions more easily: knowing when to buy, sell, or wait for confirmation.
Support and resistance are not random. They occur when supply is excessive or demand is insufficient.
At support, buyers see value and enter, but sellers are uncertain. When the market hits resistance, sellers either take their profits or go short, while buyers wait.
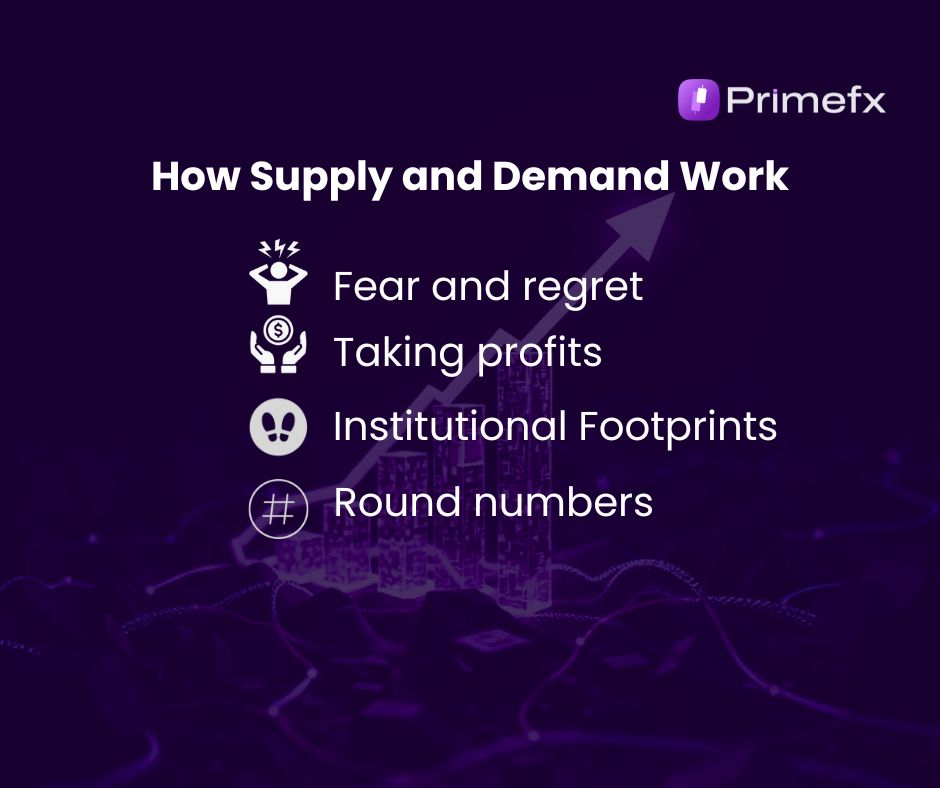
• Fear and regret: Traders who missed the chance to buy earlier often enter at support.
• Taking profits: Traders who bought at lower prices sometimes sell at resistance.
• Institutional footprints: When big funds put big orders, they make strong zones.
• Round numbers: Amounts like $50, $100, or $20,000 in crypto can frequently be psychological hurdles.
Identifying support and resistance levels is a core skill in technical analysis. These price levels guide traders in forex, crypto, and commodities, supporting entry, exit, and risk management.
Past highs and lows mark simple support and resistance. Example: $50 acts as support, and $70 as resistance. Easy to spot and ideal for beginners. These levels often serve as key decision points for range-trading strategies.
Diagonal lines connect swing highs or lows to show market direction. Upward lines act as dynamic support, and downward lines as dynamic resistance.
Trend lines help traders avoid trading against the momentum and confirm trend-continuation setups.
Popular averages, such as the 50‑day and 200‑day, serve as semi‑dynamic support and resistance levels. Prices often rebound from these levels in uptrends or encounter resistance in downtrends.
Moving averages adapt to market conditions, making them useful for long‑term forex and stock trading strategies.
Markets respect ranges more than exact points. Example: support at $48–$50; resistance at $68–$70.
Zones reduce false breakouts and reflect volatility, liquidity, and institutional orders. Traders use zones to avoid being “faked out” and to spot institutional footprints.
They highlight market psychology: where buyers see value and sellers take profits.
They provide risk-management tools; stop‑losses are often placed just beyond these levels.
They improve forecasting: knowing whether support holds or resistance breaks helps predict future price moves.
• Horizontal Levels: Easy to see, simple, and easy to understand.
• Trend Lines: Give you an idea of the overall direction of the market.
• Moving Averages: Change with the times, providing semi-dynamic support and resistance.
• Zones: Show that markets aren't exact and usually respect ranges instead of just one price.
Markets are dramatic–the resistance of yesterday often becomes today’s support. The opposition becomes support, the support becomes opposition. It is as though a change of stage set; new actors, same roles.
For example, a stock capped at $50 resistance eventually rises above it. Later, $50 acts as support. This flip is particularly valuable in the commodities and foreign exchange markets, where institutional stop-losses are often placed at these price levels.
Recognising role reversal zones helps traders forecast future market direction and refine their strategies.
Primefx insight:
In technical analysis, reversals at support and resistance levels are especially powerful in commodities and forex trading. Institutional stop‑loss orders often align with these price levels, helping traders predict future market moves and sharpen their trading strategies.
Support and resistance are important in the foreign exchange market, as currencies typically trade within ranges before breaking out.
In forex, support is a level at which buyers of EUR/USD or GBP/USD step in to stop the price from falling further. In forex, resistance is a level where sellers stop making money.
Forex traders often use moving averages and trend lines, along with these levels, to confirm signals. For instance, if the EUR/USD bounces from support and the 200-day moving average remains unchanged, traders are more confident that a rally is coming.
Levels of support and resistance are particularly important in highly volatile cryptocurrency markets.
Bitcoin often uses round numbers such as $20,000 or $30,000 as psychological support or resistance levels. Retail trader psychology can cause altcoins to react strongly when prices break certain levels.
Bitcoin: Round numbers are particularly salient to the mind.
Altcoins: Prices move quickly when they break certain levels.
Volume spikes: Demonstrate institutional involvement.
Support and resistance are the foundation of trading strategies. These price levels show where markets pause, reverse, or continue trends, helping traders plan entries, exits, and risk management.
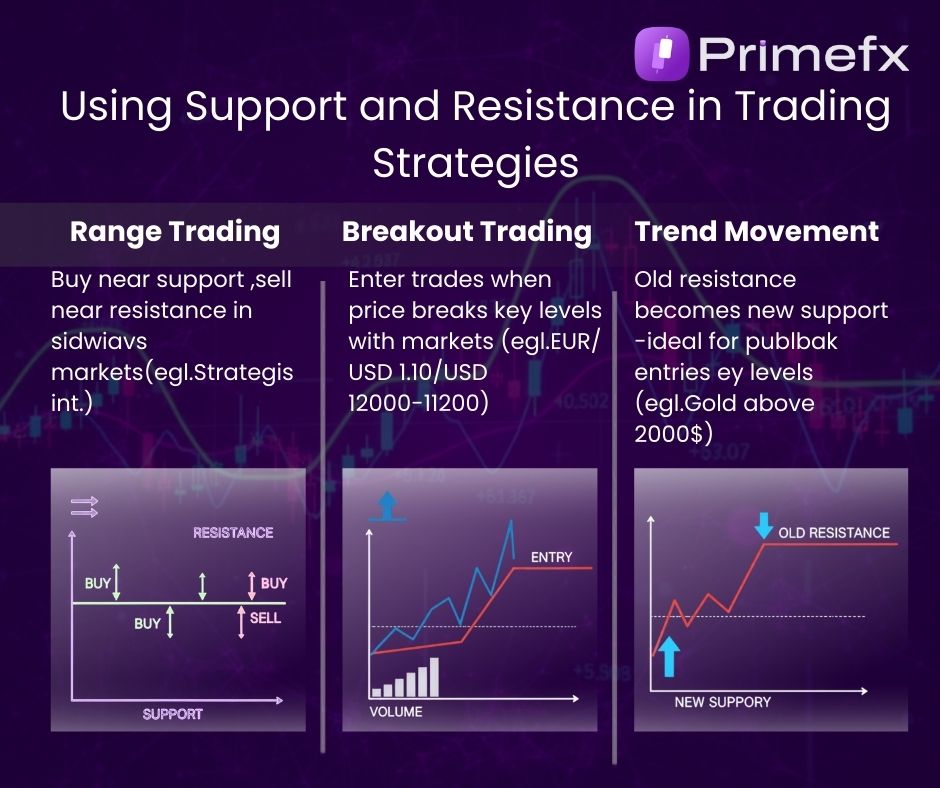
Buy near support and sell near resistance when markets move sideways. For example, if EUR/USD trades between 1.1000 (support) and 1.1200 (resistance), traders buy at 1.1000 and sell at 1.1200.
Trade when the price breaks above a resistance level or below a support level. A breakout signals strong buying or selling pressure. For instance, if Bitcoin breaks above $88,300 per coin with high volume, traders often enter long positions.
Old resistance often becomes new support, and old support becomes new resistance. This role reversal enables traders to follow the trend. Example: If gold breaks above the $ 5,100-per-ounce resistance level, that level may later act as support, creating a buy opportunity on pullbacks.
Support and resistance are not just areas where you can enter a trade; they are also points where you can leave a trade. When buying, traders place stop-loss orders just below support levels; when selling, they place them just above resistance levels.
This prevents them from making emotional decisions and ensures they adhere to their trading plan.
Setting a stop-loss: Beyond support and resistance.
ATR (Average True Range): Change the distance of your stop-loss orders based on how volatile the market is.
Position sizing: Use risk formulas to avoid excessive risk.
Many beginners create cluttered charts by adding too many lines, making analysis difficult. Some people disregard false breakouts and end up losing money on trades. Some people rely on indications, which can provide signals too late. It's also a mistake to examine only one timeframe and overlook the broader context.
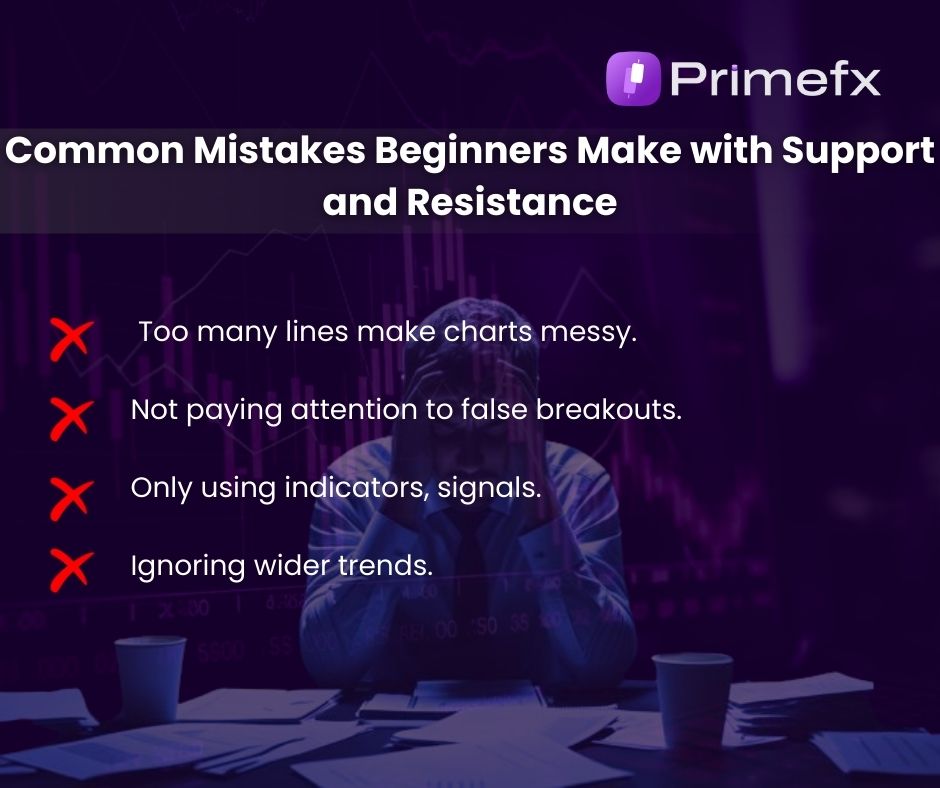
Primefx says that little is more. Pay attention to high levels of support and resistance backed by multiple signals.
Support and resistance are typically depicted as lines, whereas supply and demand zones are larger areas. In demand zones, buyers used to outnumber sellers, and in supply zones, sellers used to outnumber buyers.
These zones are stronger because they show where institutions have been. In commodities and currencies, supply and demand zones often match hedging activity. This makes them more reliable than lines drawn by retail traders.
Resistance and support are foundational concepts in trading, not just the beginning. In today’s volatile markets, especially in commodities like gold, support and resistance levels don’t always indicate reliable trends.
For example, we can say that the current gold market is behaving erratically, not in line with normal technical patterns. This is where Primefx comes in.
We go beyond basic charting. Our analysis combines several sophisticated methods, including AI-based data points,s to interpret institutional trading.
Primefx breaks down technical analysis into actionable strategies. Rather than bombarding clients with numerous charts, we make the most important support and resistance levels (smartly supported by data and professional analysis) our top priority, so you can determine when to buy or sell.
Support and resistance are more than just lines on a chart; they reveal market psychology, supply and demand, and institutional footprints. These levels guide traders on when to buy, sell, or hold, while helping forecast future price movements and manage risk.
At Primefx, we simplify support-and-resistance trading strategies with clear explanations, trend lines, moving averages, and actionable insights. With our guidance, you see where prices move, understand why, and trade with confidence.
Join Primefx now and turn insights into profitable decisions.
1. What is support and resistance in trading?
Support is a price level at which demand stops prices from falling, while resistance is a price level at which supply prevents prices from rising.
These levels guide traders on when to buy or sell.
2. How do traders use support and resistance?
They use these levels on charts to forecast future price movements, reversals, breakouts, and trend continuations, and to structure entries and exits.
3. Are support and resistance exact points or zones?
They are usually zones, not single points. Markets are volatile, so traders allow small breaches before confirming a break.
4. What happens when price breaks support or resistance?
A break below support signals bearish strength and further declines.
A break above resistance signals bullish strength and potential rallies, often confirmed by trading volume.
5. What strategies work best with support and resistance?
Range trading: Buy when support is high and sell when resistance is low.
Breakout trading: Buy when the price breaks important levels. Sell when the price breaks important levels.
Trend continuation: Ancient resistance is new support, and vice versa.
6. Can support and resistance levels change over time?
Yes. Levels may change based on market conditions, volume, and institutional activity. The resistance of the old often becomes the support of the new, and vice versa.
7. How do beginners learn support and resistance quickly?
Begin with the basic horizontal levels (past highs and lows) and then use charts. Test with demo accounts in forex or crypto to find out how prices respond to these conditions.

Sofia Alvarez is a professional market analyst and trading educator at PrimeFX Signal, with over 8 years of experience in Forex, Gold (XAUUSD), and major indices. She specializes in price-action and risk-managed swing trading, combining technical analysis, macro news, and strict risk controls to build clear, rules-based strategies for retail traders. At PrimeFX Signal, Sofia oversees trade ideas, reviews performance data, and writes in-depth guides on risk management, broker selection, and trading psychology so traders understand not just the signals but the logic behind every setup. Outside of market hours, she mentors developing traders through webinars and Q&A sessions, focusing on discipline, transparency, and sustainable long-term results in highly volatile markets.
