
Every trading service advertises its transparency. But a few actually show their homework.
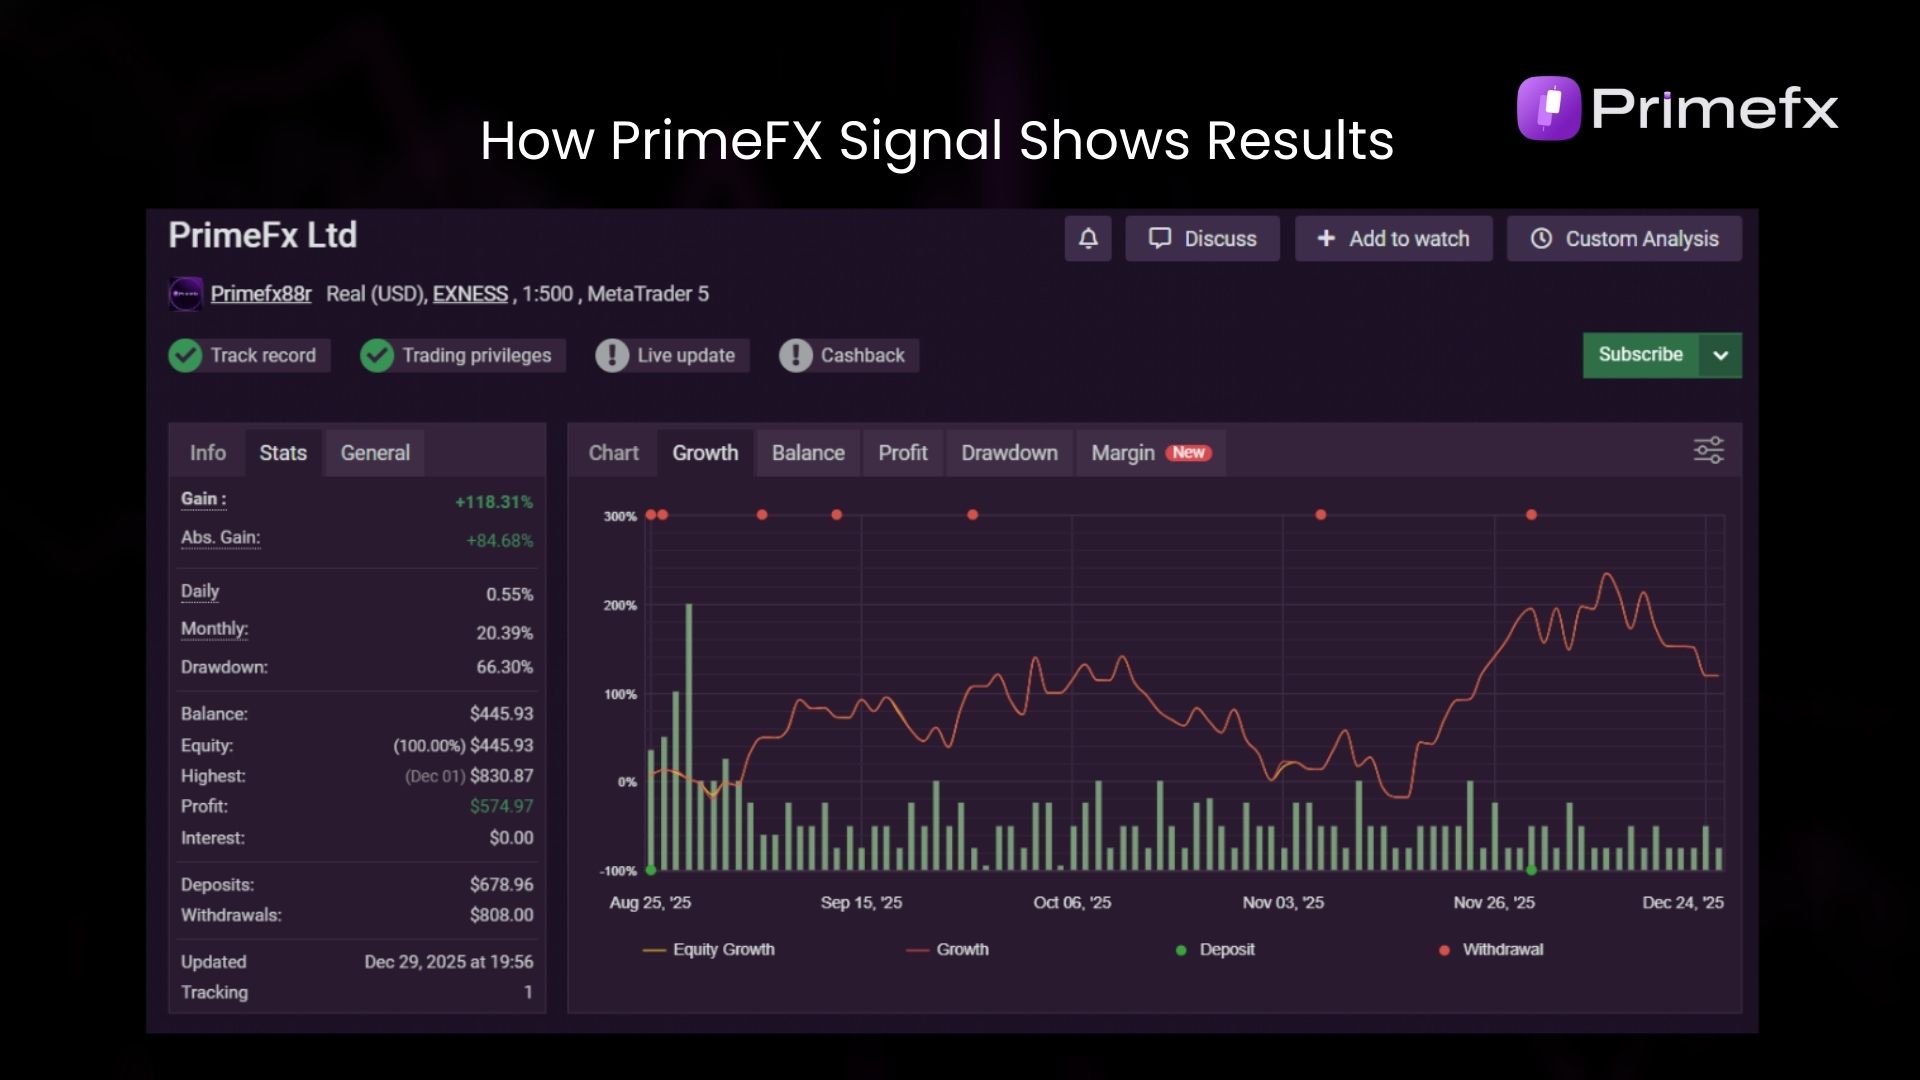
Primefx Signal, in this case, takes a different path. We publish weekly and monthly reports that not only list the numbers but also provide a breakdown of every trade. Results are presented in a detailed display, starting with pips gained or lost, win‑rate statistics, screenshots, and trade records.
You may think of it as a trading diary that you are invited to track.
Primefx does not believe in fairy tales. Our point isn’t to overwhelm you with glittery promises of guaranteed profits. Instead, our reports are designed to help you assess consistency, understand risk management, and determine whether our framework holds up.
By making our reports both accessible and auditable, we give you the magnifying glass to verify our claims rather than accept them at face value.
Transparency works best when definitions are simple and clear. Here’s how we break it down:
Signal Definition: One definite trade idea. One entry. One stop‑loss (SL). One take‑profit (TP). No hidden levers, no secret exits.
Example: Imagine we call a buy on EUR/USD at 1.655. The SL is set at 1.650 and the TP at 1.670. That’s one clean signal; nothing extra is hidden here.
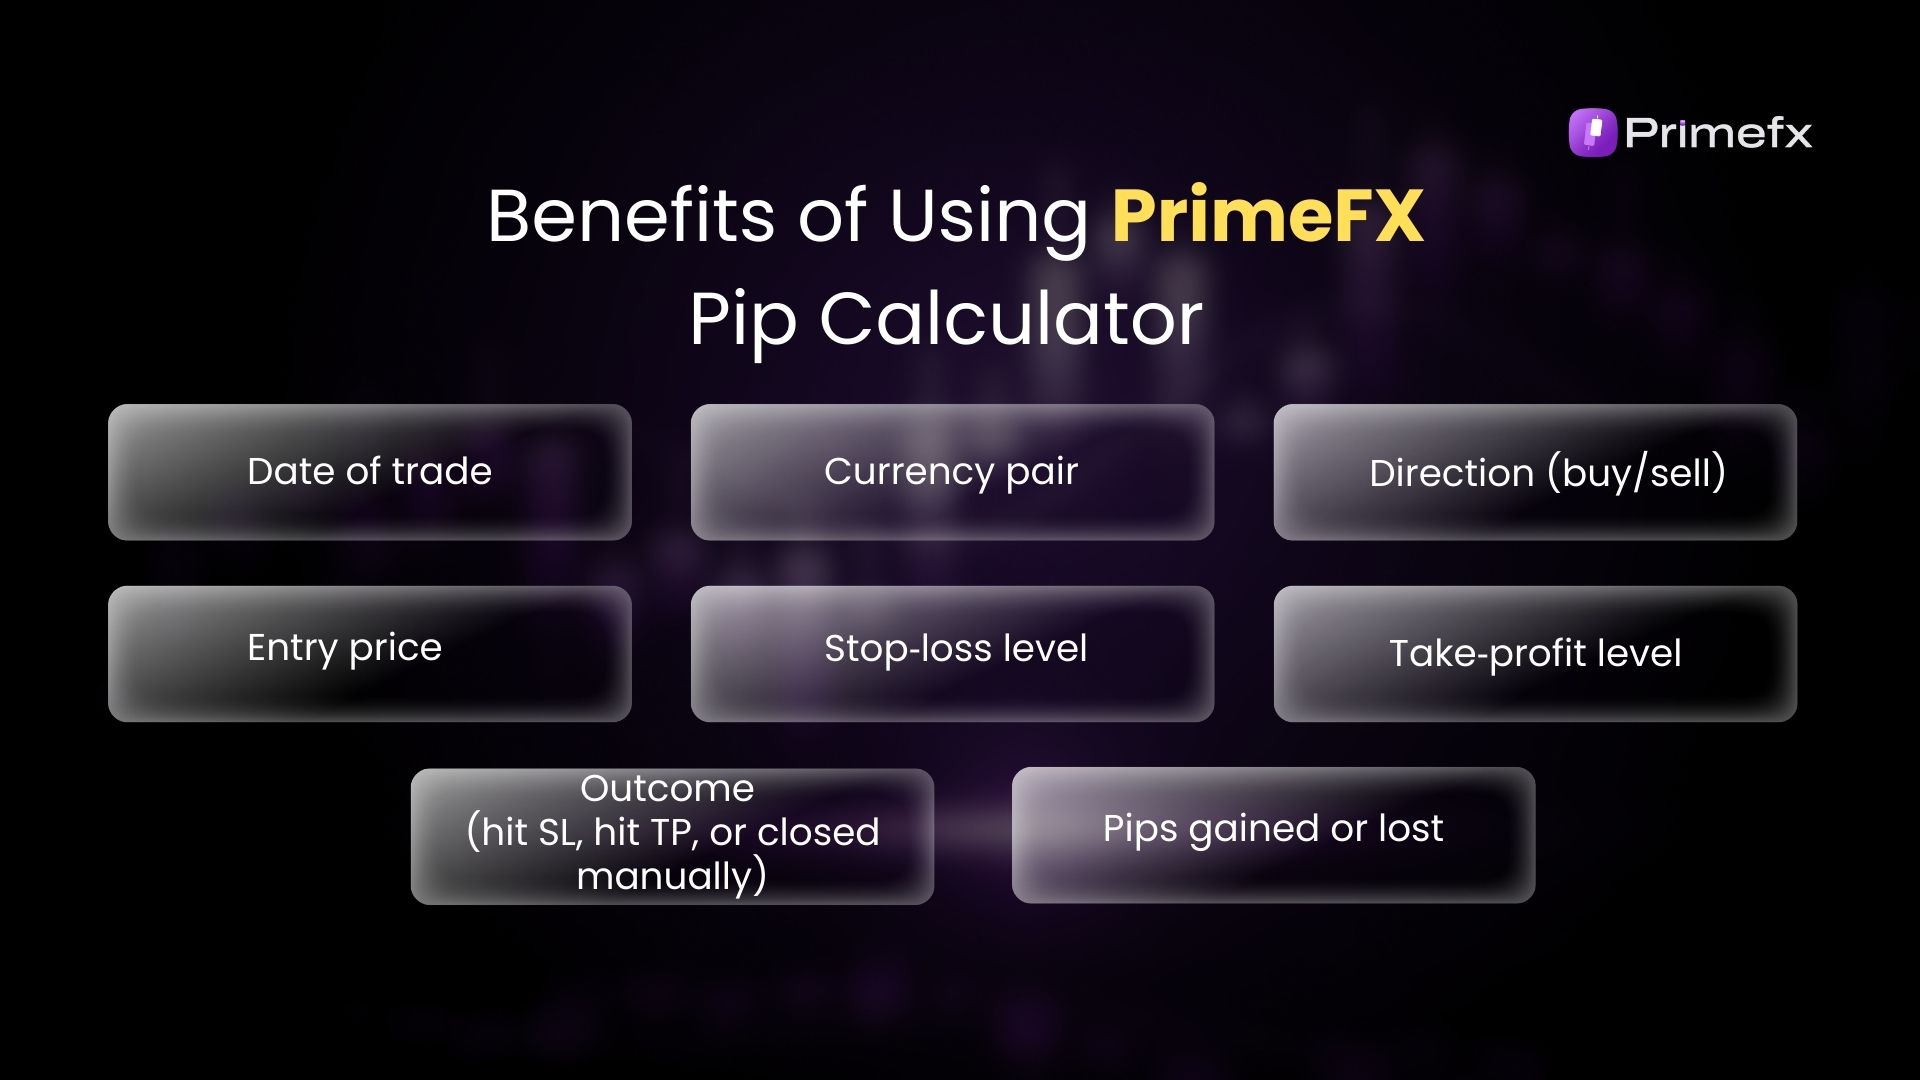
Fields Per Trade: Each line in the report consists of
Date of trade
Currency pair
Direction (buy/sell)
Entry price
Stop‑loss level
Take‑profit level
Outcome (hit SL, hit TP, or closed manually)
Pips gained or lost
It is the trading equivalent of showing your math on a test where every step is visible, and every number is accountable.
Picture this: You’re at a dinner party with friends, and one of them brags, “I made 100 pips on gold today!”
You nod your head politely and, in your mind, wonder, “Wait, isn’t gold measured in points but not pips? Did they just make up a new unit for gold?”
Here comes the twist: In the forex market, a pip usually means the fourth decimal place (0.0001). But gold (XAU/USD) doesn’t follow the same rules. Gold is quoted in points, where 1 point equals 0.01 of the price.
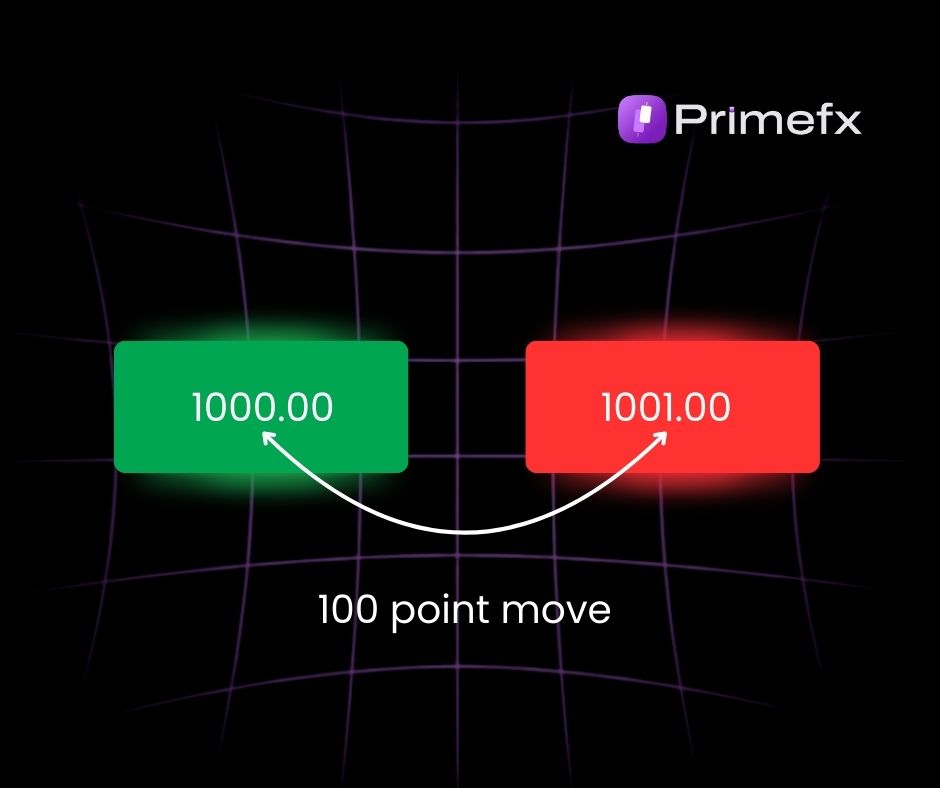
So, when XAU/USD moves from 1000.00 to 1001.00, that’s a 100‑point move.
For consistency across instruments, we refer to this as “100 pips.” It’s just like applying purchasing power parity to the theory of trading. We convert gold’s “points” into forex “pips,” the way economists translate baskets of goods across currencies into the same unit.
In short, units are different, but the values are the same. So everyone can benchmark performance at the same pace.
Lesson: Capturing pips doesn’t automatically mean big profits. Lot size, leverage, and spreads matter just as much.
The punchline is that your wallet doesn’t care about “pips” only. It has to care about:
Lot size: A 0.10 lot vs. a 1.00 lot changes the dollar value drastically.
Think of it like ordering French fries—regular vs. large size. Same fries, different quantity and impact.
Broker spreads: Some brokers set wider spreads on gold, which directly affect the net pips.
Like paying extra tips for your fries.
Slippage: During periods of high market volatility or news events, orders may fill at the worst possible prices.
Like ordering your fries when there is a discount at the restaurant. Good luck with getting that on time.
Execution timing: Entering even a few points after the posted signal can significantly alter the outcome.
Like showing up late to the party. The best dishes are already gone.
It does not guarantee profit, but it indicates the extent of market movement. That is the reason our PIP reporting is standardized.
Now, it is a question whether that movement becomes money or not, which depends on:
Lot Size: Larger lots imply larger profits or losses.
The timing of execution: Late entry can significantly alter the outcome.
Slippage: Broker spread and volatility can affect your fill price.
So now, when a person tells you that the market is doing 100 pips of gold, bear in mind that it is just the size of the move. The real result is determined by the manner in which you trade it.
We at Primefx maintain consistent reporting to ensure you are not confused by movement.
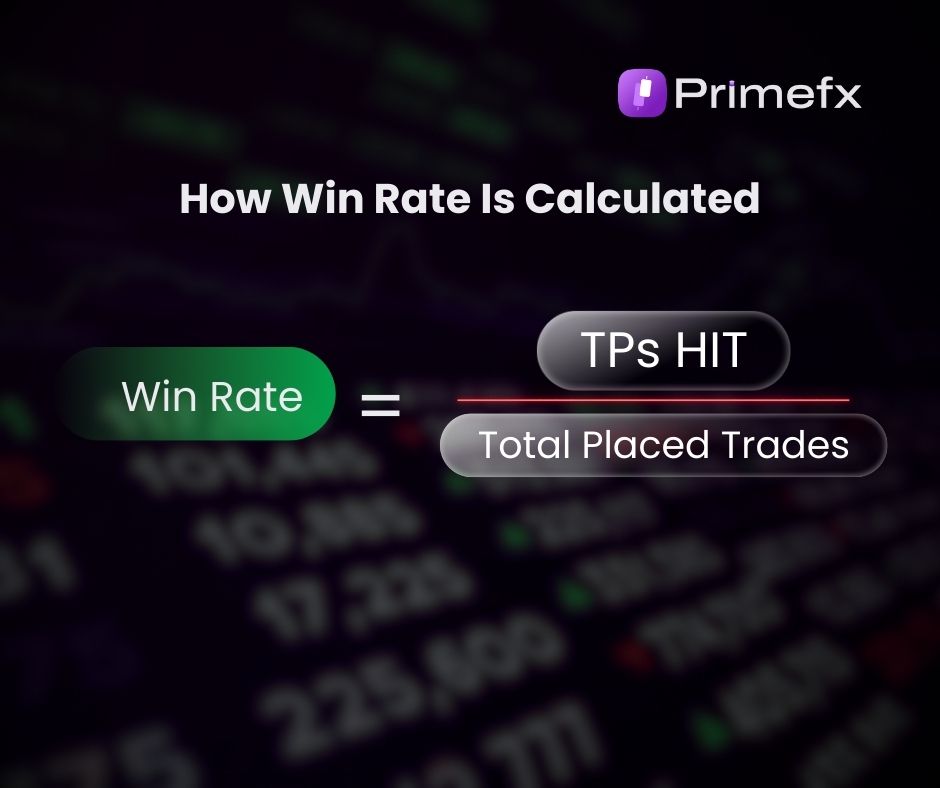
Win rate is just simple math:
Win rate = TPs Hit ÷ Total Placed Trades
Here’s where we draw the line between a signal and a noise:
Trades that were actually executed with definite entry, SL, and TP.
Outcomes that hit SL or TP.
Trades closed manually.
Results backed by screenshots.
Cancelled trades (ideas that never left your notebook).
Missed entries (price that never touched the entry level).
Partial closes (Primefx doesn’t do them; trades run to full SL or TP).
“At Primefx, even if a trade runs 100 pips in profit, we only count it when it actually hits the take‑profit. It means our win rate and pip counts aren’t packed with “almosts” or “maybes.”
Example:
Picture a scoreboard:
10 trades placed
8 hit TP
2 hit SL
Win rate = 8/10*100% = 80%
It is that simple. No hidden math tricks and no “almost wins” and “maybes” in the statistics.
We advise subscribers to verify their posted trade lists against their execution records. And here the comedy of the trading life comes in:
The approach remains the same in the implementation, but reality differs. That is the reason why we keep reminding you: results vary, but the formula can be audited.
The win rate at Primefx is not some magic number—it is a scoreboard that you can look at yourself. Open, straightforward, and auditable. Consider it the whistle of the referee in the trading field: sharp, loud, and in imitation.
Without evidence, numbers are mere symbols. Such values lack credibility and don’t drive any decisions.
That’s why every report at Primefx is paired with screenshots and trade records. We aim for no hidden trades, no selective memory.
And as trust is stronger when there exists a verified third party, you can cross‑check us here:
Myfxbook: Independent performance tracking and community reviews.
Primefx Testimonials: Real traders sharing their experiences, available on the Primefx testimonial page.
These platforms act as external referees. They ensure our reporting isn’t just internally consistent but also publicly assessable
By defining what counts, excluding what doesn’t, and opening our reports to weekly and monthly third-party verification, Primefx Signal stands out beyond a marketing claim. It is a transparent daybook where you can read, question, and verify your trading results.
That’s how we believe performance reporting must look—auditable, trustworthy, and helpful for traders who care about transparency over promises. Primefx's motto is clear: no hype, no hidden trades.
Transparency in trading isn’t a statement. It is a discipline. By spelling out what counts, excluding what doesn’t, and opening our records to third‑party verification, Primefx Signal turns performance reporting into something you can actually count on by yourself.
Every pip, every win rate, and every screenshot is part of a notebook that you can cross‑check with an independent platform like Myfxbook.
This isn’t about gimmicks or “guaranteed profits.” It’s about giving you the instruments to judge consistency, understand risk, and decide whether our signals match your trading style.
We believe our traders deserve clarity, not marketing gloss—and our weekly and monthly reports are built to deliver exactly what traders expect.
Ready to explore the numbers by yourself? See the latest reports for independent analysis and community feedback.
What is included in Primefx's weekly/monthly pips reports?
All the signals that are executed are displayed in our reports in detail: date, direction, pair, entry price, stop loss, price at which profit was taken, result, and gained/lost pips.
We also provide screenshots and trade records to demonstrate transparency. The pip numbers include only trades that were opened and closed, not those that were cancelled or missed.
How do you calculate win rate?
Win rate is calculated as winning signals ÷ total closed signals. A closed signal means a trade that hit a stop‑loss, reached a take‑profit, or was closed manually, with proof screenshots.
Cancelled trades or missed entries are not counted. This formula consistently and audibly reports results, so you can verify our win rate against the posted trade list.
Do you hide losing trades?
No. We have a definite "No Hidden Trades" policy. All trades that receive a stop-loss hit or are manually closed are reported, along with screenshots and records.
The win rate is calculated with losing trades. You have the full picture. This makes our reporting transparent, auditable, and free of bias from selective reporting and marketing hype.
Where can I see third‑party references for Primefx Signal?
You can verify our performance on independent platforms such as Myfxbook and PrimeFX Testimonials, which provide community reviews and verified statistics.
Why is my PIP totally different from the report?
Differences occur since execution varies from trader to trader. The most common causes are late entries after a signal is posted, different spreads across brokers, and slippage due to volatility or news events.
Adjustments to account for leverage or risk settings, as well as errors in manual execution, are also included. This is why we note: pip totals reflect movement, but outcomes fluctuate.

Sofia Alvarez is a professional market analyst and trading educator at PrimeFX Signal, with over 8 years of experience in Forex, Gold (XAUUSD), and major indices. She specializes in price-action and risk-managed swing trading, combining technical analysis, macro news, and strict risk controls to build clear, rules-based strategies for retail traders. At PrimeFX Signal, Sofia oversees trade ideas, reviews performance data, and writes in-depth guides on risk management, broker selection, and trading psychology so traders understand not just the signals but the logic behind every setup. Outside of market hours, she mentors developing traders through webinars and Q&A sessions, focusing on discipline, transparency, and sustainable long-term results in highly volatile markets.
